All about Coronavirus
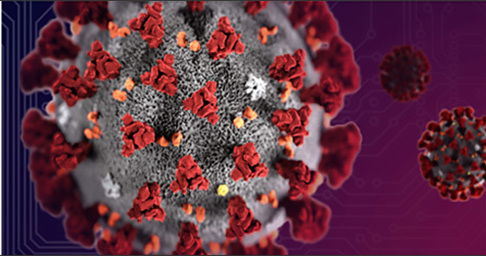
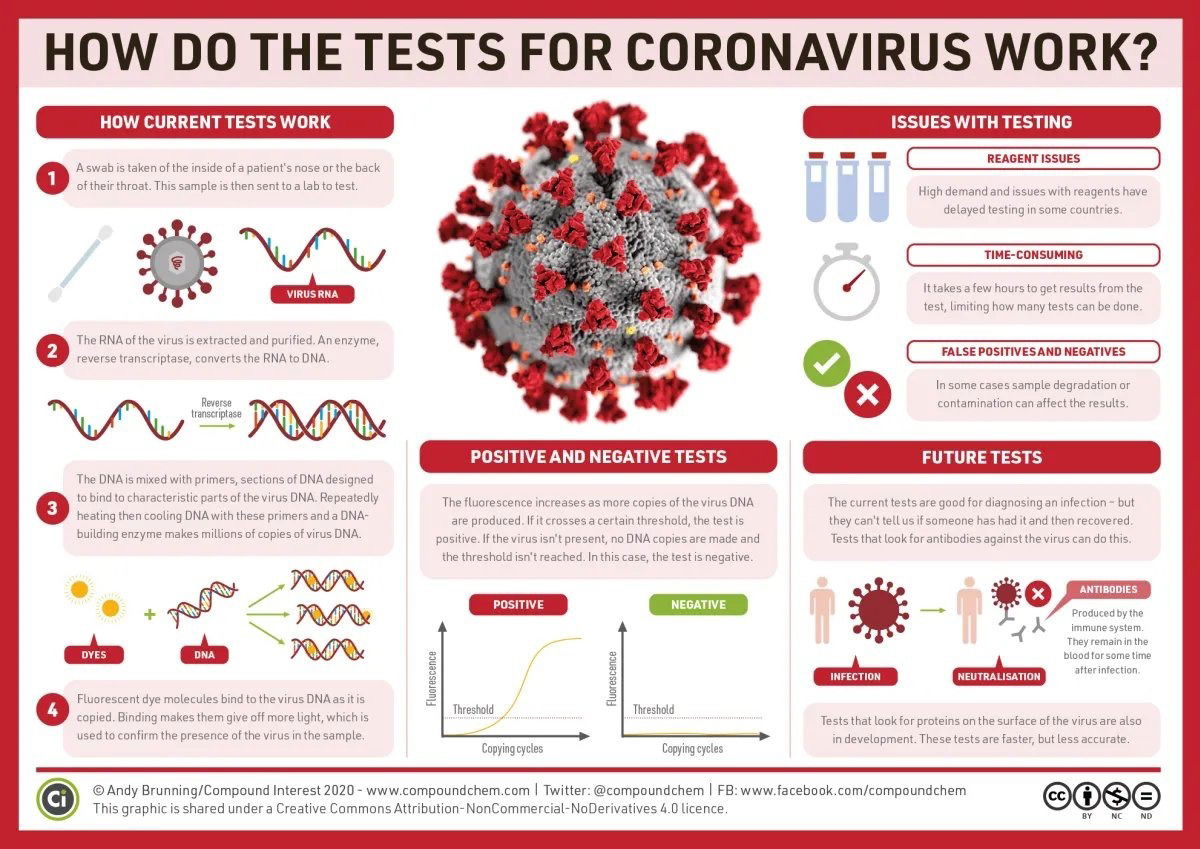
On the 31st March we discussed viruses (not surprisingly!). We chatted about what they are, how they reproduce and mutate, how to design an antiviral, and how social isolation can help. In reality, viruses are so small that we cannot see them with a normal microscope. However, using some special instruments called electron microscopes can see them! The image above shows a computer-generated representation of Coronavirus based on what we know about it. The spikes represented in red are special molecules, proteins, the virus uses to infect our cells.
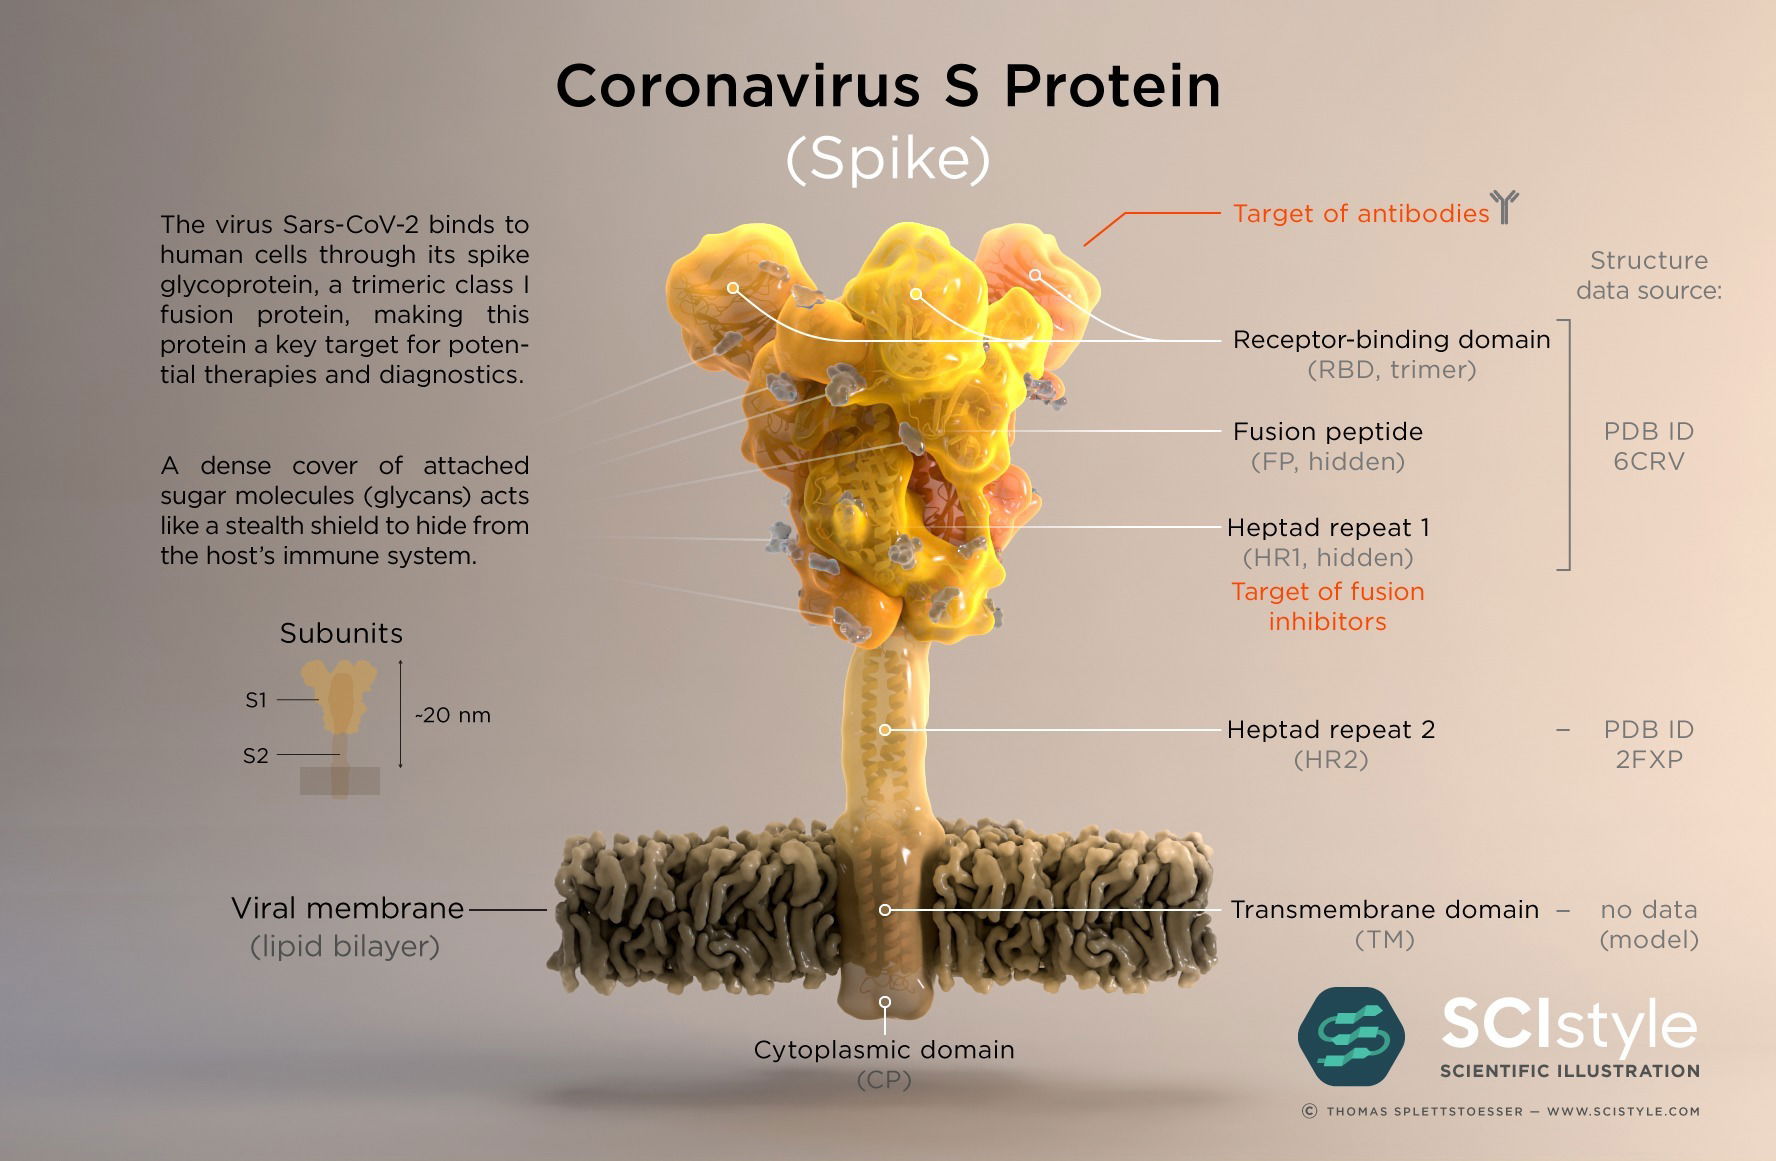
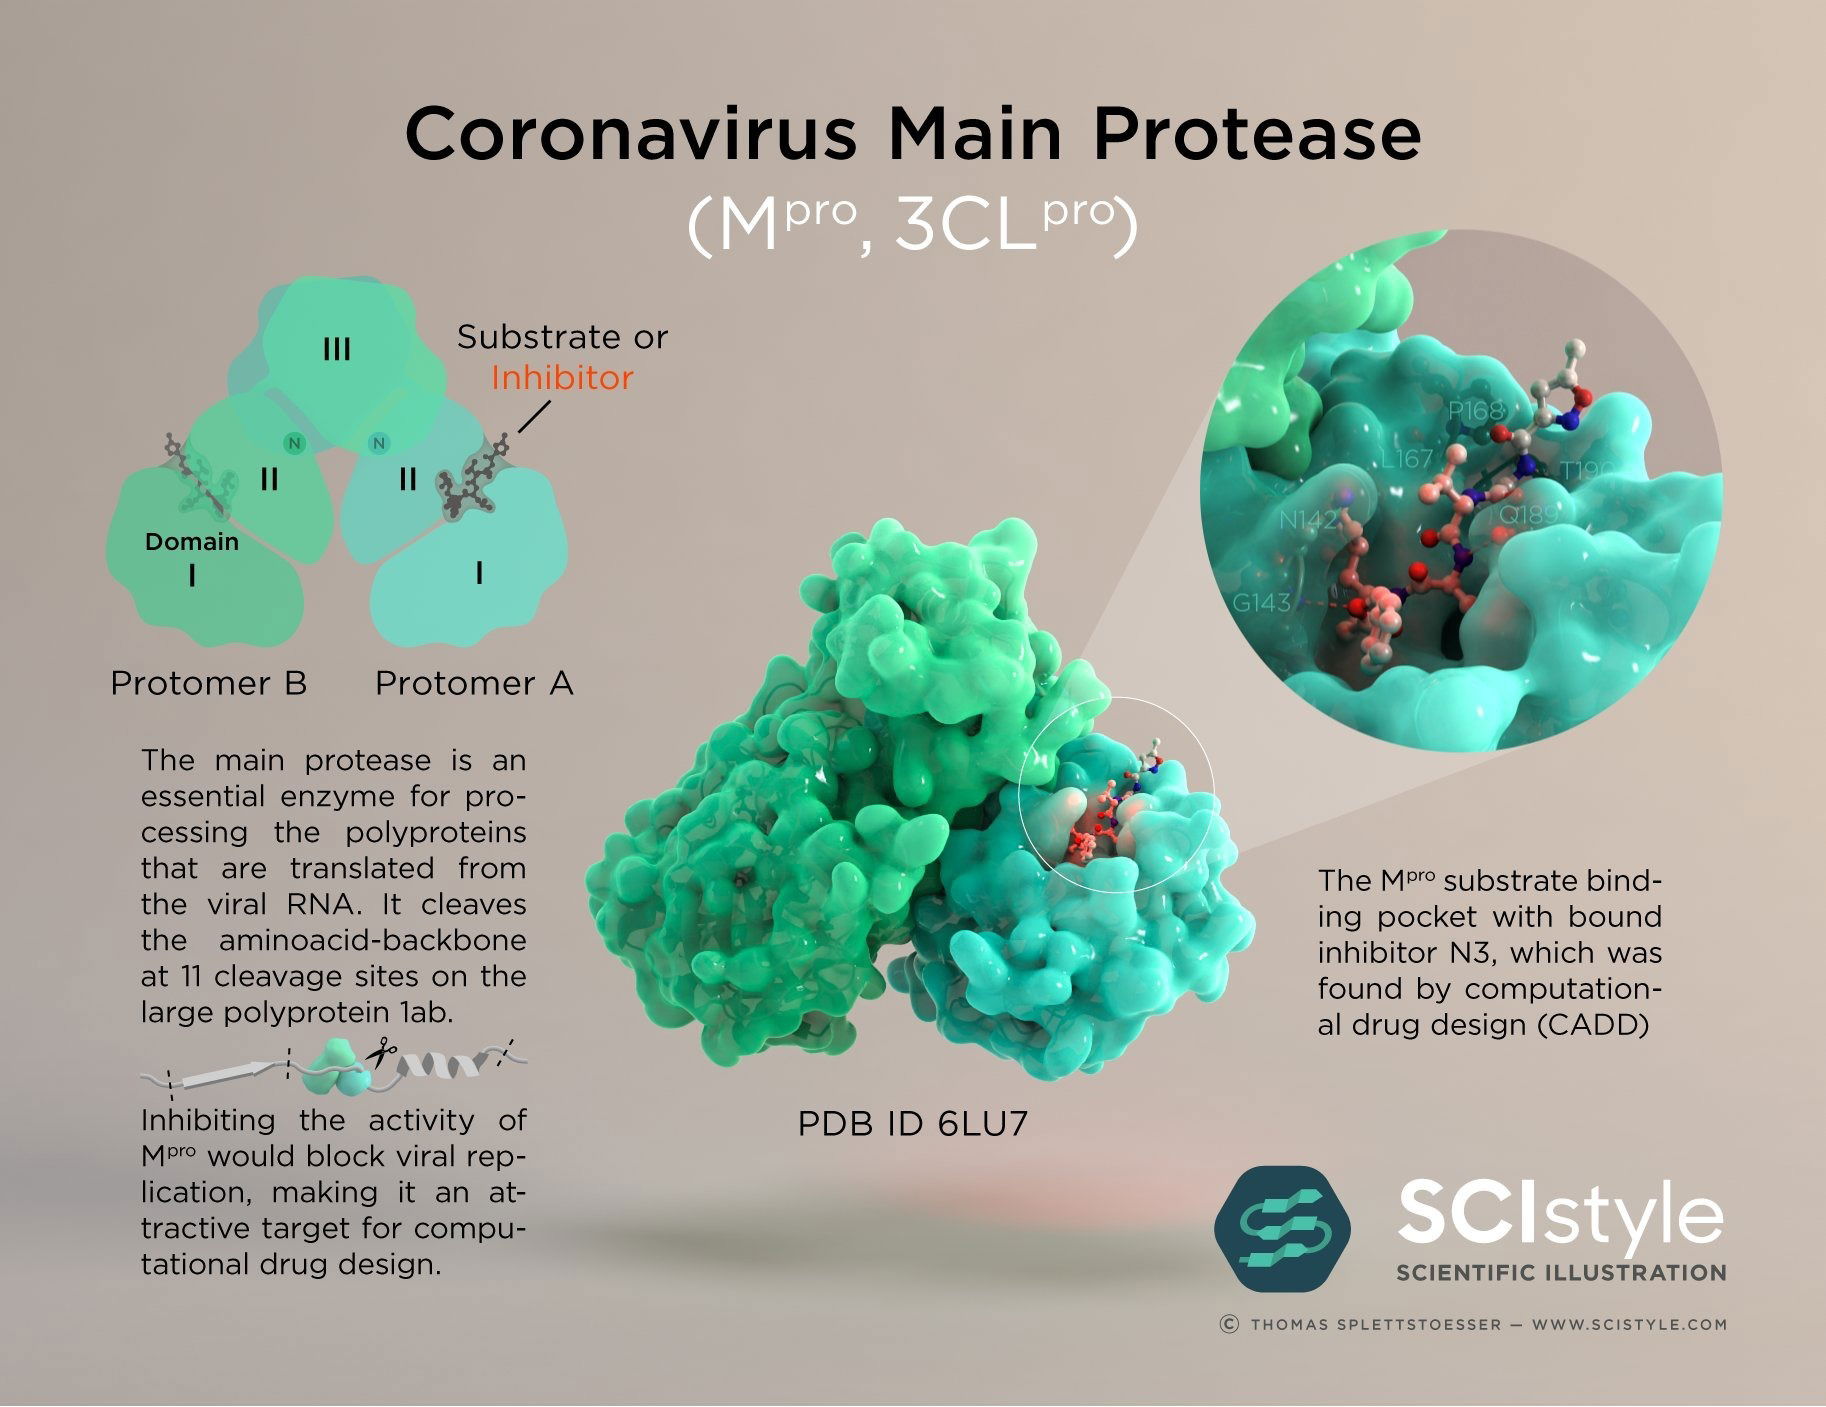
- Here you can see some details of the structure of coronavirus. Images created by Thomas Splettstößer, follow him on Twitter @splette!
- A beautiful animation explaining how viruses reproduce
- The Protein Data Bank explains why it is important to wash our hands with soap in order to defend ourselves from viruses.
- Here is an explanation of how we can check if a person is infected with Coronavirus
- Bill Gates gave a talk about pandemics in March 2015, and it is still very actual
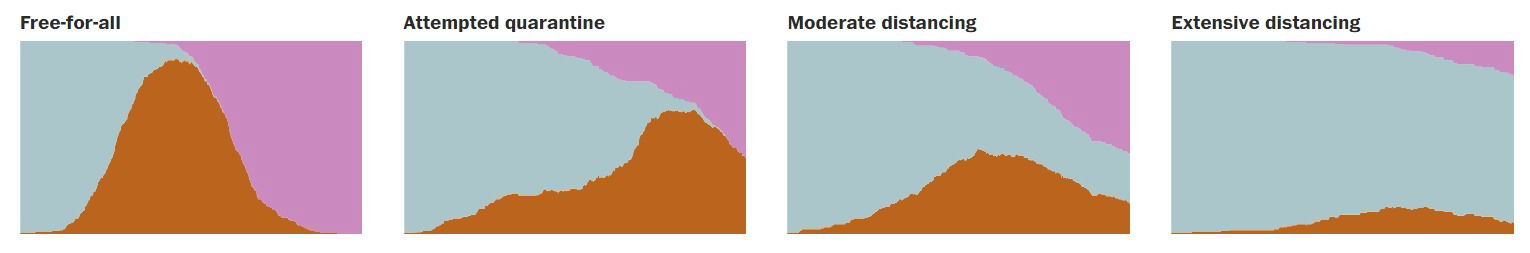
- The Washington Post published an interactive article presenting simulations of the spread of a disease, and how various methods of control can affect the number of ill (brown), healthy (light blue) and immune (pink) people in the population, as time passes.
- The website Our World in Data presents graphically data to understand global problems.
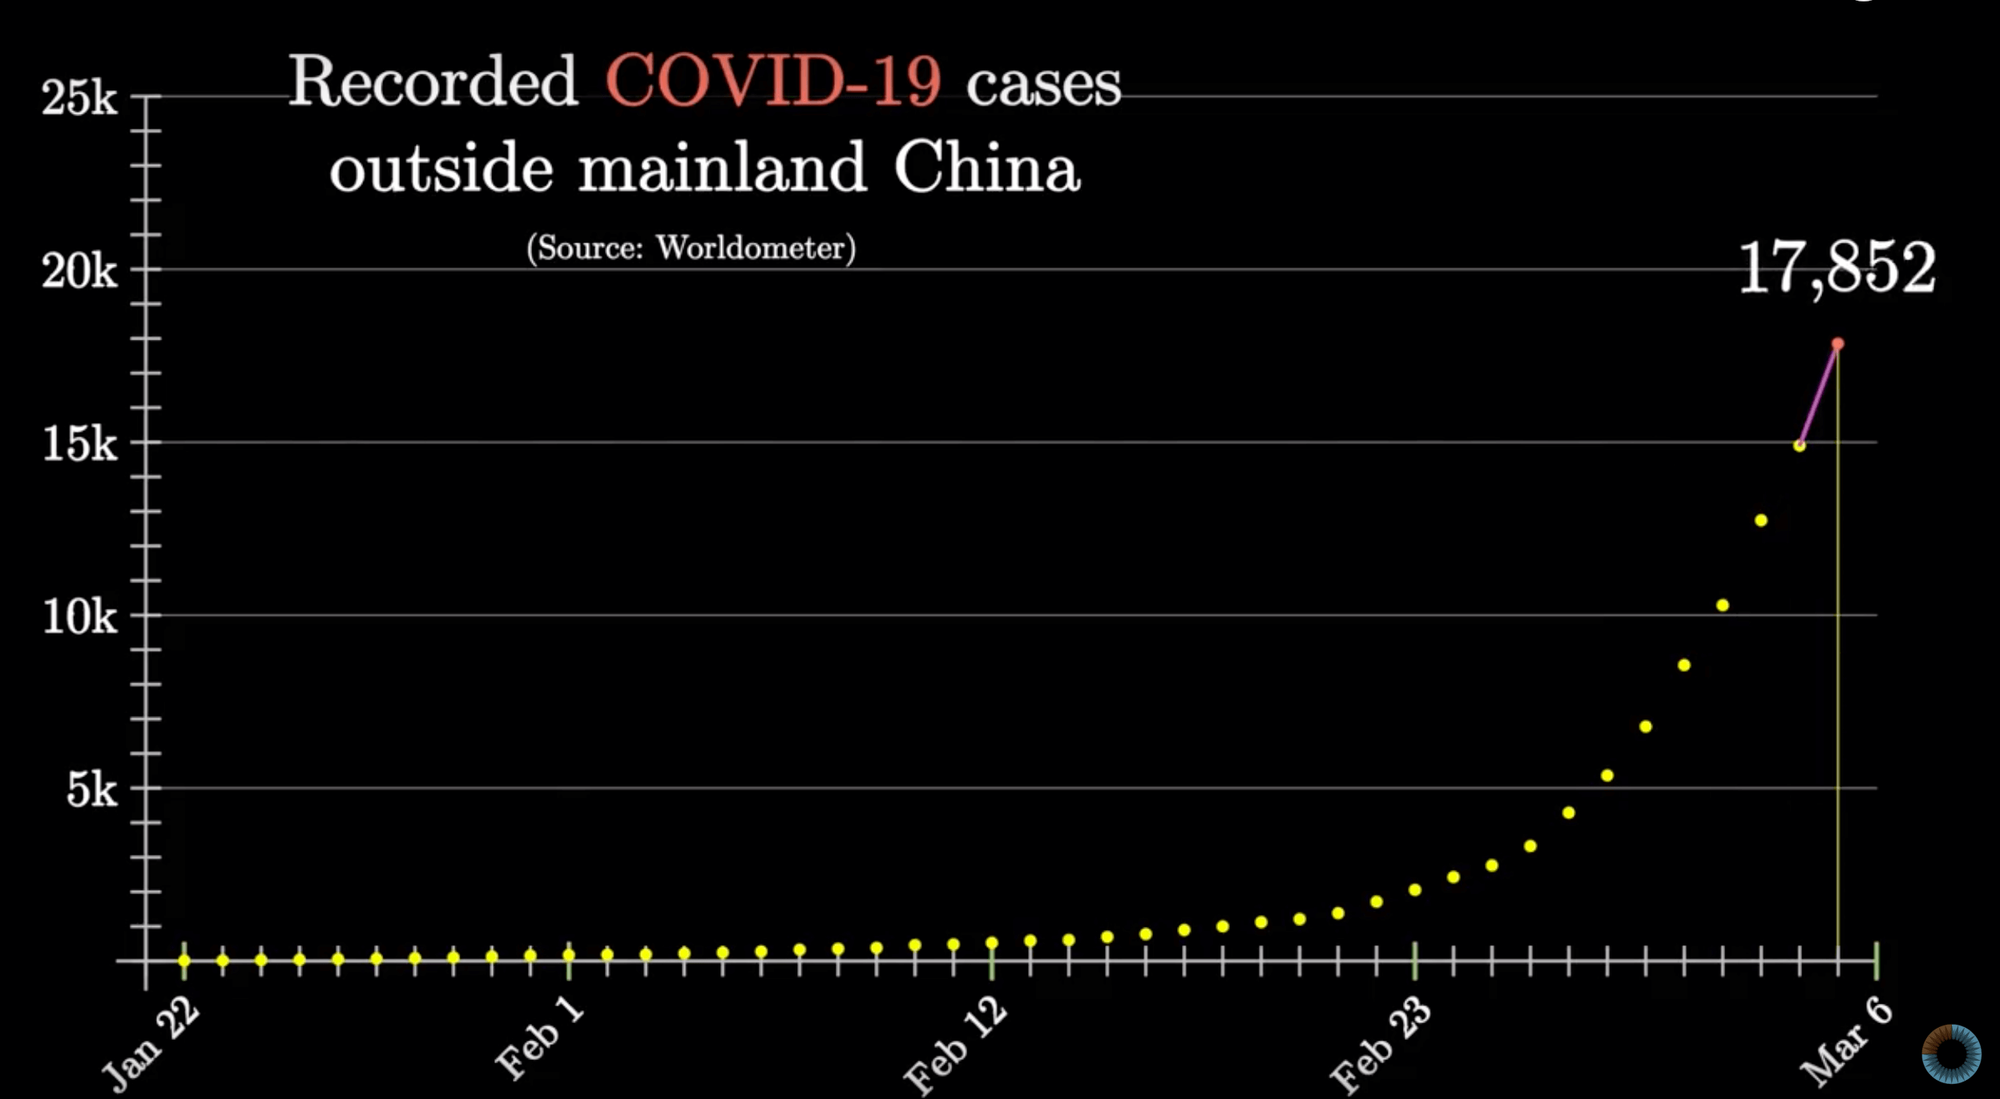
Below you can see data representing COVID-19 cases. Charts are interactive (click here to see more data about this).
- A brilliant video by 3Blue1Brown describing the exponential and logistic curves that COVID-19 follows – slightly more technical but excellent to better understand the trends in the propagation of a virus and which factors can be used to alter it (with beautiful animations).
We will continue to post links to relevant material here.
Please also share anything interesting you find and ask questions!